When you create a new report template, add the charts you need. You can also add free text field(s) for your own notes.
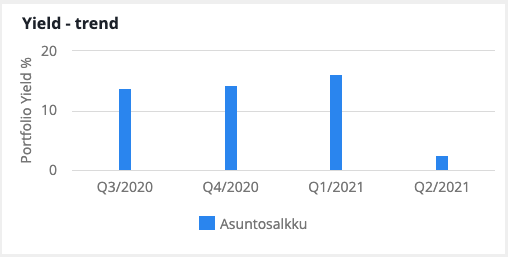
Yield (trend curve)
This option allows you to create a trend curve based on the yield of the portfolio. It shows the percentage for the quarter for the entire portfolio.
The calculation formula is NOI currency / (latest) property value currency * 100
Investment (pie chart)
The chart includes a breakdown by market value. Values greater than 5% are presented on a property-by-property basis. If the value is less than 5%, they are calculated in the Other segment.
Properties > Info tab, Asset valuation

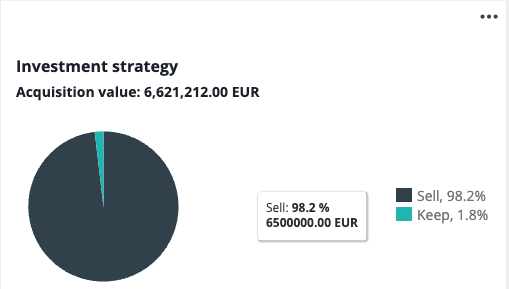
Investment strategy (pie chart)
The acquisition value is based on a combination of the acquisition values of the entire fund and the breakdown is made using the strategy. The pie chart shows the percentage of the strategy.
Properties > Strategy tab
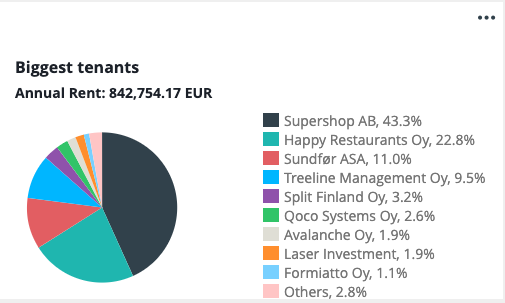
Biggest tenants (pie chart)
The chart shows the 9 biggest tenants according to the expected rental income. Rest of the tenants are calculated in the Other segment.
Rent roll (table)
When creating a table, you can choose whether to take future leases into account. Additionally, you can remove data from the view by clicking the three lines and then the data to be removed. Clicking it again will bring it back.
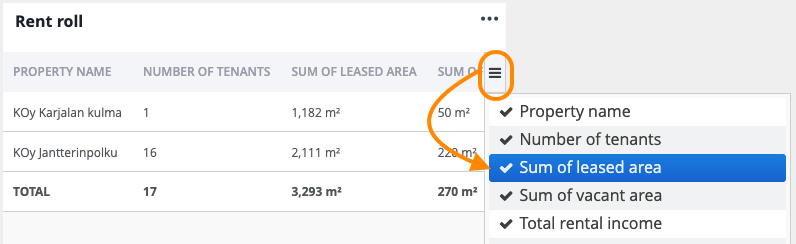
Data to be included in the table:
- property name
- number of tenants
- sum of leased area (m²)
- sum of vacant area (m²)
- total rent income
- vacancy
- vacancy amount (€)
- maturity
- main tenant
- leased area of the main tenant (m²)
- total rent income (main tenant)
- main tenant rent in % (compared to the total rent roll)
Use the scroll bars in the bottom/on the right to see the data in the table.
Fund information
When creating fund information, you can choose to display all of the information below or remove some of it by clicking the X.
- This action cannot be undone, so if you accidentally remove the required information, you will need to re-create the widget.
- Click on the three dots > Edit > Create. This will revert the data.
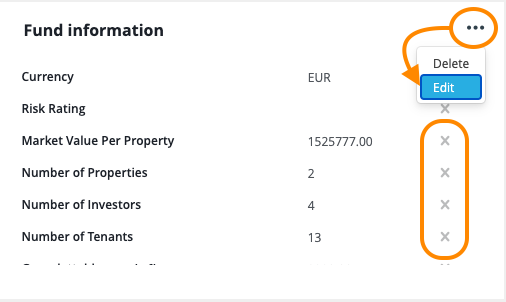
Use the scroll bar on the right to see all values.
- Currency
- Risk Rating
- Market Value Per Property
- Number of Properties
- Number of Investors
- Number of Tenants
- Gross lettable area (m²)
- Occupancy rate (%)
- Average length of the lease agreement
- Equity in the company - the fund's share of the total company
- Bank Loans
- Committed Capital - money which an investor has agreed to contribute to an investment fund.
- Allocated Equity - capital allocated to specific accounts or purposes
- Non Allocated Equity
- Maturity
- Loan To Value - the amount needed to receive a down payment
- Interest Rate Protection (%)
Free text
This is an open text box for your own notes. Click the pencil icon to edit text; use basic formatting tools (bold, italic, underline, superscripts like m², subscriptions like Chex = 12dec = 14oct, or permille ‰ ), create bulleted or numbered lists, and add hyperlinks. Save the changes made.

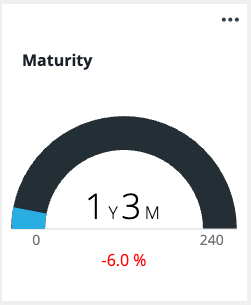
Maturity (gauge)
This metric shows the average maturity of the entire fund portfolio.
Related articles
Commenting on the quarterly reports
Presenting and downloading a report
0 Comments