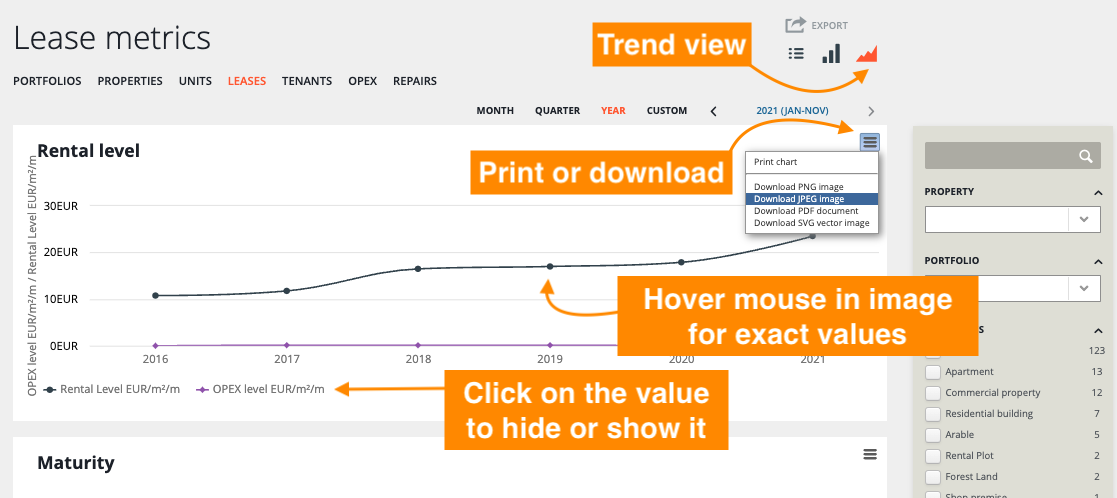
The trend view visualizes the data in different graphs, allowing you to select the content to display. You can print each chart, or download them as a PDF document or images.
In the chart below you find the information for the lease metrics, how the values are calculated, and where the data is from. The Data Source column helps to check and correct any incorrect or missing values. You can also check the table view for missing information.
KPIs take into account filters and the selected time period.
| Rental level | The fluctuation of the rental level and the OPEX level | avg. (property monthly GRI) / leased net floor area = rental level avg. (property monthly OPEX) / leased net floor area = OPEX level |
Properties > (choose a property) > Financial info Leases > (select a lease) > Periods > (select a period), Monthly rent |
| Maturity | The average expiration time of leases in months and/or years based on a monthly rent and duration of leases. Reflecting the risk of property being vacant. - Length of a fixed term lease is between the time selection and the ending date. - Length of a lease valid until further notice is the notice period (set by the user or default 3 mo). |
avg. (lease length) = maturity | Leases > (choose a lease) > Contract, Lease information |
0 Comments