The dashboard view visualizes the KPI calculations and allows you to present them directly from the user interface.
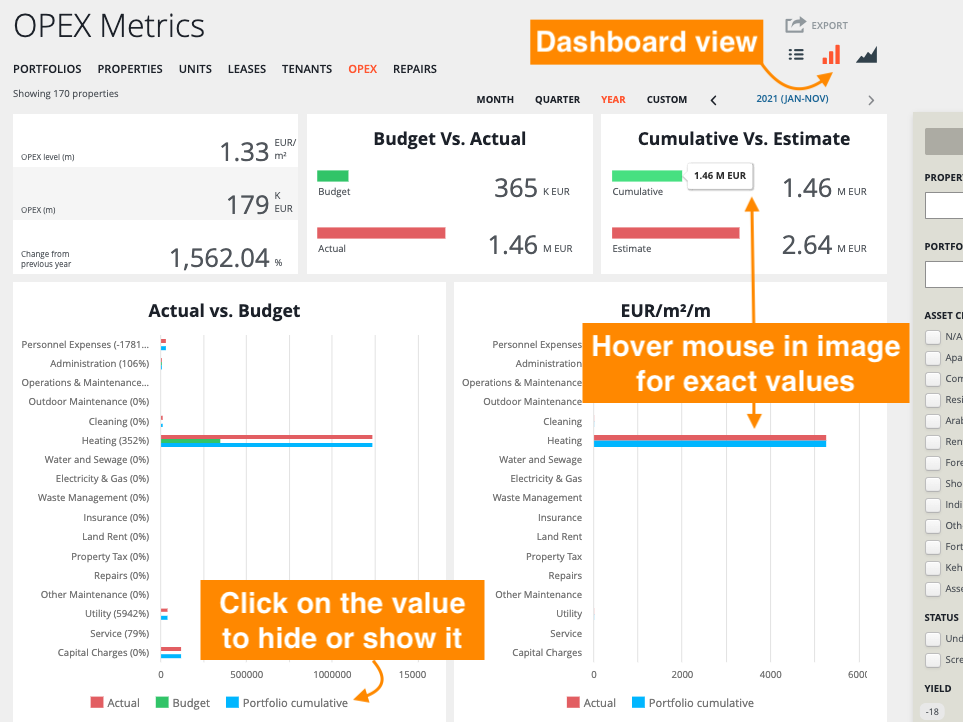
In the chart below you find the information for the OPEX metrics, how the values are calculated, and where the data is from. The Data Source columns helps you to check and correct any incorrect or missing values. You can also check the table view for missing information.
KPIs take into account filters and the selected time period. For the current year the KPIs measure performance from January to the current month.
| OPEX level (m) | The monthly operational expenses per m²/ft² | monthly OPEX / ∑ total area of all properties = OPEX level | Properties > (choose a property) > Info, Buildings Properties > (choose a property) > Financial info |
| OPEX (m) | The monthly operational expenses in total | ∑ OPEX | Properties > (choose a property) > Financial info |
| Change from previous year | Previous year's OPEX is compared to the current year's OPEX, the change from previous year is showed in % | 100% - (current year OPEX / previous year OPEX) * 100 = change from previous year | Properties > (choose a property) > Financial info |
| Budget Vs. Actual | The budget for OPEX is compared to the actual costs | N/A | Properties > (choose a property) > Financial info |
| Cumulative Vs. Estimate | The sum of the OPEX actuals from the beginning of the selected period Vs. estimated OPEX based on average monthly costs of the year | ∑ costs = cumulative (avg. monthly costs) * 12 = estimate |
Properties > (choose a property) > Financial info |
| Actual vs. Budget | The comparative between different costs budgets, actuals and the cumulative for the portfolio | ∑ OPEX type | Properties > (choose a property) > Financial info |
| EUR/m²/m | Monthly costs per m²/ft² for different actual costs compared to the portfolio average | ∑ costs / ∑ total area | Properties > (choose a property) > Financial info Properties > (choose a property) > Info, Buildings |
0 Comments