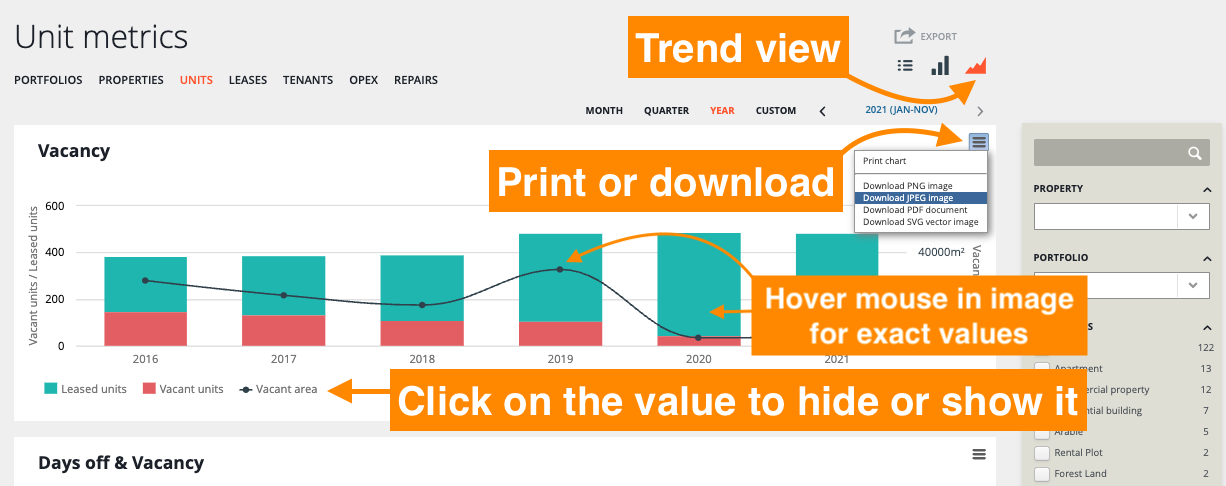
The trend view visualizes the data in different graphs, allowing you to select the content to display. You can print each chart, or download them as a PDF document or images.
In the chart below you find the information for unit metrics, how the values are calculated, and where the data is from. The Data Source column helps to check and correct any incorrect or missing values. You can also check the table view for missing information.
Descriptions and calculations refer to the units selected and the result depends on the time selection (e.g. year 2020: average vacancy is from Jan - Dec 2020).
| Vacancy | Total vacant area of units, the number of leased units and the number of vacant units | ∑ vacant area = vacancy | Units > (choose a unit) > Leases |
| Days off & Vacancy | The average vacancy in percentages and the average number of days that a unit has been vacant | vacant unit area / property GLA * 100 = monthly property vacancy rate (%) | Units > (choose a unit) > Leases |
0 Comments