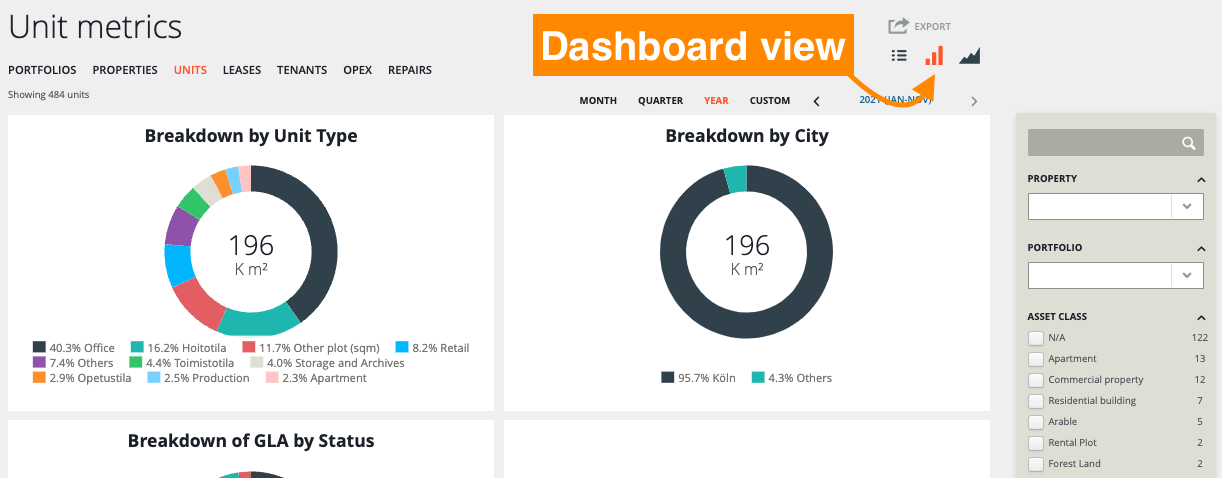
The dashboard view visualizes the KPI calculations and allows you to present them directly from the user interface.
In the chart below you find the information for the unit metrics, how the values are calculated, and where the data is from. The Data Source column helps you to check and correct any incorrect or missing values. You can also check the table view for missing information.
Descriptions and calculations refer to the units selected and the result depends on the time selection (e.g. year 2020: vacant units are from Jan - Dec 2020).
| Breakdown by unit type | A representation of the share that all units within a certain unit type take up of the total area of all units/properties | unit type area / ∑ unit types area * 100 = breakdown by unit type | Units > (choose a unit) > Info > Premise/Unit information |
| Breakdown by city | Breakdown of the leasable area by city and its share of the total leasable area as a percentage. | leasable area by city / ∑ leasable area by all cities * 100 = breakdown by city | Properties > (choose a property) > Info, Street address Units > (choose a unit) > Info, Premise/Unit information |
| Breakdown of GLA by Status | Breakdown of leased area by occupany / vacancy rate | (∑ GLA - ∑ leased areas) / ∑ GLA * 100 = breakdown of GLA by status | Properties > (choose a property) > Info, Buildings |
| Unit Area | The total area of all units | ∑ units area = unit area | Units > table or list view |
| Total Units | The number of units | ∑ units = total units | Units > table or list view |
| Vacant Units | Number of vacant units | total units - leased units = vacant units | Units > table or list view > filter vacant units |
0 Comments