The dashboard view visualizes the KPI calculations and allows you to present them directly from the user interface.
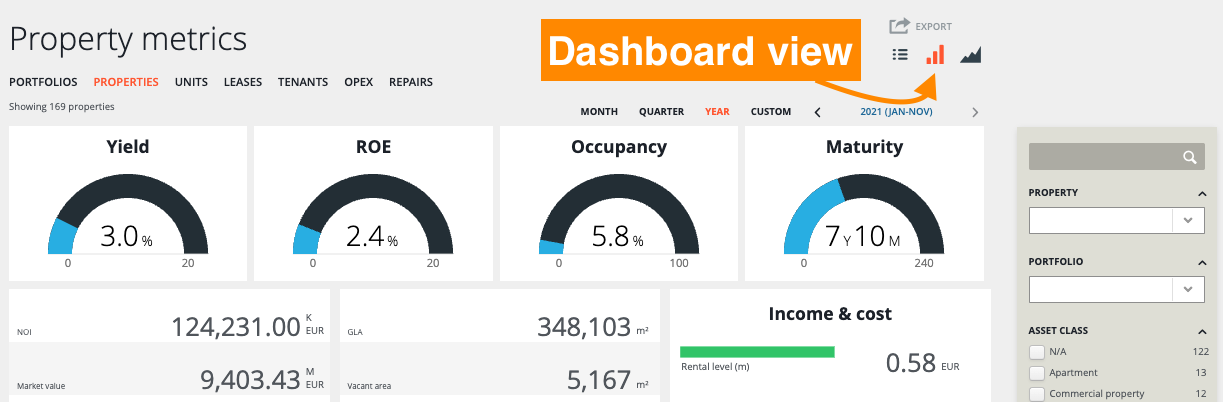
In the chart below you find the information for the property metrics, how the values are calculated, and where the data is from. The Data Source column helps you to check and correct any incorrect or missing values. You can also check the table view for missing information.
Descriptions and calculations refer to the properties selected and the result depends on the time selection (e.g. year 2020: NOI is from Jan - Dec 2020 and valuations are taken from 2020 or before).
| Yield | The return rate of a property based on the property’s net operating income and market value. | (NOI mo / monthly value) * 100 = yield% | Properties > (choose a property) > Financial info, NOI OR Properties > (choose a property) > Info, Commercial info |
| ROE | Return on equity is used to follow how profitable the asset is in relation to invested equity | NOI mo / (monthly value - loan allocation) * 100 = ROE mo | Properties > (choose a property) > Financial info, NOI Properties > (choose a property) > Info, Asset valuation |
| Vacancy or Occupancy | Measuring the share of a property’s vacant areas to its gross lettable area | (vacant area / GLA) * 100 = vacancy rate (%) (occupied area/GLA) * 100 = occupancy rate (%) |
Properties > (choose a property) > Info, Commercial info |
| Maturity |
The average expiration time of leases in months and/or years based on a monthly rent and duration of leases. Reflecting the risk of property being vacant.
|
∑ (monthly rent * lease length) / ∑ monthly rent = maturity | Leases > (choose a lease) > Periods Leases > (choose a lease) > Contract, Lease information (lease end date or notice period) |
| NOI | The net operating income | gross operating income - operating expenses = NOI mo | Properties > (choose a property) > Info, Commercial information |
| Market value (in currency) | The most recent market value | ∑ market values | Properties > (choose a property) > Info, Asset valuation |
| Market value (EUR/m²) | Measuring the most recent market value per m²/ft² | market value / total area = market value per m² or ft² | Properties > (choose a property) > Info, Asset valuation Properties > (choose a property) > Info, Buildings |
| Total area | The total surface area of a building incl. vacant areas | ∑ building total area | Properties > (choose a property) > Info, Buildings |
| GLA | The revenue-generating space, i.e. the floor area that can be leased to tenants (m²/ft²) |
∑ gross lettable areas | Properties > (choose a property) > Buildings > (choose a building) > Info, Measurements |
| Vacant area | The non-leased area (m²/ft²) | ∑ vacant area | Properties > (choose a property) > Info, Rent roll |
| Rental level (m) | The average rent per m²/ft² | avg. (property GRI mo) / property net floor area = rental level mo | Units > (choose a unit) > Summary |
| OPEX level (m) | The average of operational expenses |
avg. (monthly OPEX per m² or ft²) = OPEX level mo |
Properties > (choose a property) > Info, Commercial Information Properties > (choose a property) > Buildings > (choose a building) > Info, Measurements, Net floor area |
| Share of NOI (Portfolio) | Shows how much of the portfolio NOI the property takes | NOI of properties / NOI of portfolio * 100 = share of NOI (portfolio) | Properties > (choose a property) > Info, Commercial information |
| Share of NOI (Asset class) | Shows how much of the asset class NOI the property takes | NOI of properties / NOI of all properties in the same asset classes * 100 = share of NOI (asset class) | Properties > (choose a property) > Info, Commercial information |
| Share of Value (Asset Class) | Shows how much value the filtered properties sum up compared to the total value of the same asset classes | value of properties / total value of all properties in the same asset classes = share of value (asset class) | Properties > (choose a property) > Info, Asset valuation |
0 Comments