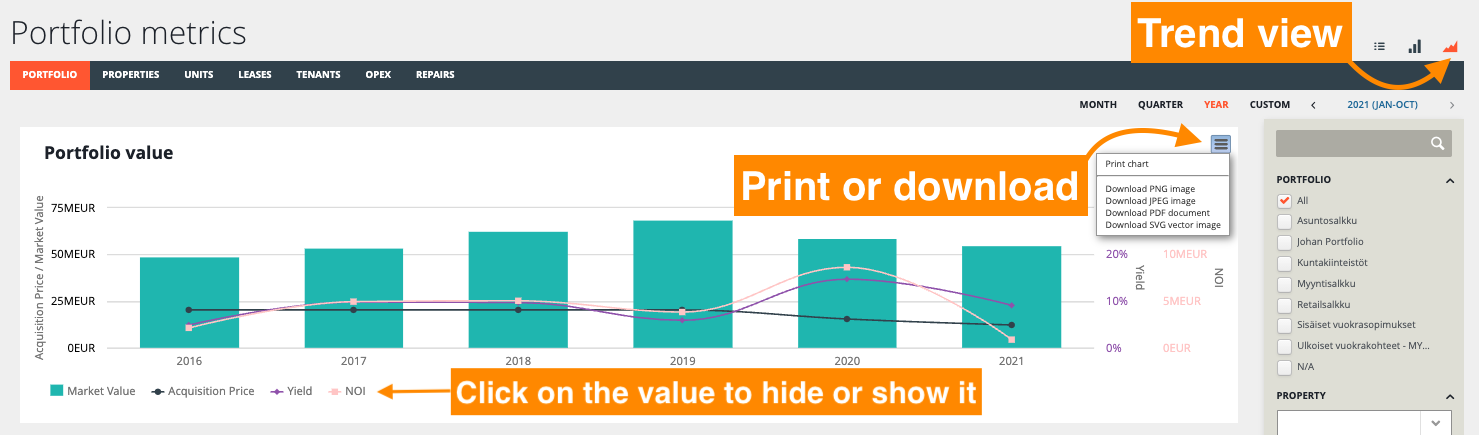
The trend view visualizes the data in different graphs, allowing you to select the content to display. You can print each chart, or download them as a PDF document or images.
In the chart below you find the information for portfolio metrics, how the values are calculated, and where the data is from. The Data Source column helps to check and correct any incorrect or missing values. You can also check the table view for missing information.
Descriptions and calculations refer to all properties in the selected portfolio(s) and the result depends on the time selection (e.g. year 2020: NOI is from Jan - Dec 2020 and valuations are taken from 2020 or before).
| PORTFOLIO VALUE | Portfolio value shows the sum of market values, acquisition price, yield and NOI |
∑ properties market value = portfolio market value ∑ properties acquisition price = portfolio acquisition price ∑ properties yield = portfolio yield ∑ properties NOI = portfolio NOI |
Properties > (choose a property) > Info > Asset valuation Properties > (choose a property) > Financial info, NOI |
| GRI + VACANCY | The fluctuation of vacancy and its share of the GRI from the vacancy amount | (vacant unit area / property GLA) * 100 = portfolio vacancy rate (%) ∑ properties GRI = portfolio GRI (∑ units monthly rent / ∑ units rented surface area) * property vacant area = portfolio vacancy (amount) |
Vacant areas: Properties > (choose a property) > Info, Rent roll GLA: Properties > (choose a property) > Buildings > (choose a building), Measurements |
| TOTAL RETURN | Measures the annual return rate and capital gain. Change in value indicates the increase or decrease of market value, yield indicates the return on investment. | portfolio yield + portfolio capital gain = portfolio total return (%) | Properties > (choose a property) > Info, Asset valuation Properties > My portfolios > (choose a portfolio) > Financial info, NOI |
| PORTFOLIO YIELD | The historical yield of the different asset classes | (NOI * 12) / market value * 100 = yield | Properties > (choose a property) > Info, Asset valuation Properties > My portfolios > (choose a portfolio) > Financial info, NOI |
0 Comments