The dashboard view visualizes the KPI calculations and allows you to present them directly from the user interface.
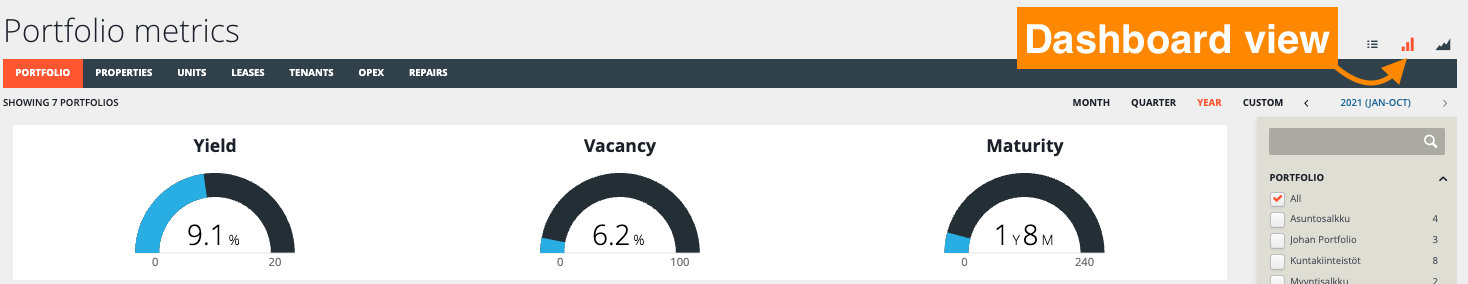
In the chart below you find the information for the portfolio metrics, how the values are calculated, and where the data is from. The Data Source column helps you to check and correct any incorrect or missing values. You can also check the table view for missing information.
Descriptions and calculations refer to all properties in the selected portfolio(s) and the result depends on the time selection (e.g. year 2020: NOI is from Jan - Dec 2020 and valuations are taken from 2020 or before).
| YIELD | A return measuring an investment over a set period of time (%) | (NOI * 12) / market value * 100 = yield | Properties > (choose a property) > Info, Asset valuation Properties >My portfolios > (choose a portfolio) > Financial info, NOI |
| ROE | Used to follow the profitability of an asset in relation to the invested equity | NOI mo / (market value mo - loan allocation) * 100 = ROE mo | Properties > (choose a property) > Financial info, NOI Properties > (choose a property) > Info, Asset valuation |
| VACANCY OR OCCUPANCY |
The vacancies of all properties in the filtered portfolios. If you want to show occupancy instead, please contact support@assetti.pro |
(vacant area / GLA) * 100 = vacancy rate (%)
|
Vacant areas: Properties > (choose a property) > Info, Rent roll GLA: Properties > (choose a property) > Buildings > (choose a building) > Info, Measurements |
| MATURITY |
The average expiration time of leases in months and/or years based on a monthly rent and duration of leases. Length of a fixed term lease is between the time selection and the ending date. Length of a lease valid until further notice is the notice period (set by the user or default 3 mo). |
∑ (monthly rent * lease length) / ∑ monthly rent = maturity | Leases > (choose a lease) > Periods Leases > (choose a lease) > Contract, Lease information |
| BREAKDOWN OF VALUE |
A share of the total value by portfolio | (value per portfolio / sum of portfolio values) * 100 = breakdown of value | Properties > (choose a property) > Info, Asset valuation |
| BREAKDOWN OF NOI | A share of the total NOI by portfolio | (properties GRI - properties costs) / NOI * 100 = breakdown of NOI | Properties > My portfolios > (choose a portfolio) > Financial info, NOI |
| NOI & YIELD | A representation of the total NOI and yield of each portfolio | ∑ properties NOI = portfolio NOI (NOI * 12) / market value * 100 = yield |
Properties > (choose a property) > Info, Asset valuation Properties > My portfolios > (choose a portfolio) > Financial info, NOI |
| YIELD | Showcases top and bottom 5 properties by yield | (annualised portfolio yields) / (n) = portfolio yield for (n) months (%) | Properties > (choose a property) > Info, Asset valuation Properties > (choose a property) > Financial info, NOI |
| BREAKDOWN OF VALUE BY PROPERTY ASSET TYPE | A representation of the share of the value that properties in a certain property asset class take up in each portfolio | (value per portfolio / sum of portfolio values) * 100 = breakdown of value |
Properties > (choose a property) > Info, Asset valuation Properties > (choose a property) > Info, General Information, Property asset type |
| BREAKDOWN OF NOI BY PROPERTY ASSET TYPE |
A representation of the share of NOI that properties in a certain property asset class take up in each portfolio | (property types GRI - costs) / (sum of NOI of the portfolios) * 100 = breakdown of NOI |
Properties > (choose a property) > Financial info, NOI Properties > (choose a property) > Info, General Information, Property asset type |
0 Comments